Tableau Interview Questions
BI dashboards are similar to the car dashboard.
The car dashboard provides the complete status of the working of a car, such as Gas, mileage, Air pressure, and so on.
BI Dashboard provides a snapshot of the organization or Key Performance Indicator (KPI).
The car dashboard provides the complete status of the working of a car, such as Gas, mileage, Air pressure, and so on.
BI Dashboard provides a snapshot of the organization or Key Performance Indicator (KPI).
Dashboards in Tableau are created by either clicking on the Dashboard icon at the bottom of the screen
- or from the Menu/ Dashboard.
- Dashboards contain one or multiple sheets.
- Actions provide interactivity to the dashboards.
- Filters present in the individual sheets are to dashboards too. These filters can be applied to a specific sheet or all sheets using the data source.
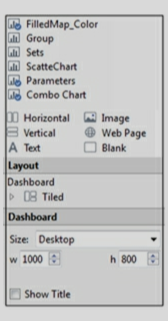
- The dashboard contains “Dashboard Objects”. These objects are available in the left pane. These dashboard objects are layout containers – horizontal or vertical. These objects can be used to add Image, webpage, text, and Blank container. Use these objects to enhance your dashboard.
- Dashboard size and sheet coordinates can also be specified.
Exercise: Create a Dashboard using Sheets, FilledMap_color, Combo chart, Parameters, and TableCalculation_Rank.
![]()
- or from the Menu/ Dashboard.
- Dashboards contain one or multiple sheets.
- Actions provide interactivity to the dashboards.
- Filters present in the individual sheets are to dashboards too. These filters can be applied to a specific sheet or all sheets using the data source.
- The dashboard contains “Dashboard Objects”. These objects are available in the left pane. These dashboard objects are layout containers – horizontal or vertical. These objects can be used to add Image, webpage, text, and Blank container. Use these objects to enhance your dashboard.
- Dashboard size and sheet coordinates can also be specified.
Exercise: Create a Dashboard using Sheets, FilledMap_color, Combo chart, Parameters, and TableCalculation_Rank.
Interactivity between dashboards is achieved by the use of “Actions”.
Actions provide interactivity to the dashboards. Actions can be of different types
Filter Actions. This type of Action is used to create interaction between the sheets in a dashboard.
Highlight Actions. It is used to color the selected Marks on a chart.
URL Actions. This type of Action is used to create a hyperlink to another webpage.
Actions can be configured by navigating to Menu – Dashboard/Actions.
“Use as filter” property in a chart, makes the data element in that chart act as a filter to other sheets/charts.
On the desired chart, click on the pulldown menu on the right and select Use as Filter.
On the desired chart, click on the pulldown menu on the right and select Use as Filter.
*/?>
*/?>
*/?>
*/?>