Tableau Interview Questions
When Tableau Desktop is installed, Tableau creates a folder called “My Tableau Repository” in the \Documents folder.
The folder contains all the files required by Tableau
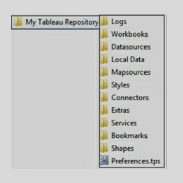
• Logs, the folder contains all the issue logs.
• Workbooks contain all the workbooks – twb and twbx files. Save all your workbooks in this folder.
• Datasources, this folder is used to keep all the data source files such as csv, excel, etc.
• Local Data, when custom geocoding is imported, it gets stored in this folder.
• Map sources, Tableau Map Source (.tms) file is stored in this folder.
• Bookmarks, with .tbm file extension, are stored in this folder.
• Shapes, this folder contains all the shapes provided by Tableau. To add your custom shapes, copy custom shapes in an image format and add to a new folder under this folder.
• Preference.tps, the file is used to add custom color palettes.
The folder contains all the files required by Tableau
• Logs, the folder contains all the issue logs.
• Workbooks contain all the workbooks – twb and twbx files. Save all your workbooks in this folder.
• Datasources, this folder is used to keep all the data source files such as csv, excel, etc.
• Local Data, when custom geocoding is imported, it gets stored in this folder.
• Map sources, Tableau Map Source (.tms) file is stored in this folder.
• Bookmarks, with .tbm file extension, are stored in this folder.
• Shapes, this folder contains all the shapes provided by Tableau. To add your custom shapes, copy custom shapes in an image format and add to a new folder under this folder.
• Preference.tps, the file is used to add custom color palettes.
Tableau desktop is a development environment and provides functionality to develop interactive dashboards.
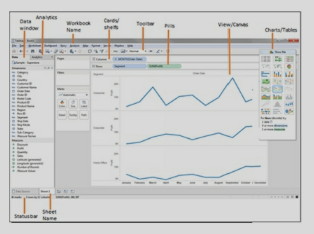
1. Data window. Displays information about the data connection and fields in the data source.
2. Analytics. Contains ready-to-use objects for faster analysis of data.
3. Workbook Name. The workbook consists of data connection, worksheet, dashboard, stories, and images. Worksheet name has an extension of .twb. If it is a packaged workbook then the extension is .twbx.
4. Cards/shelves. Views are created by placing fields on the cards or shelves. Mark cards have different shelves such as color, size, label, detail, tooltip. Fields can be placed on these shelves. Changing the Mark type like Automatic, Shape will change these shelves.
5. Toolbar. The toolbar provides quick access to different functionalities such as undo/redo, adding sheets, sorting, displaying labels, and so on.
6. Pills. Fields or calculations on the rows or columns are called Pills. Click on a pill to access pull-down menu options such as filter, Table calculations, etc. The dimension pill is blue in color and Measure pill is green.
7. View/Canvas. This space displays visualization created by the fields placed on the shelves.
8. Filters. A filter shelf is used to place filters that limit the data.
9. Pages. This shelf displays views on different pages. If a dimension is placed on Pages, it creates separate pages for each dimension. If a measure is used, then measure is converted to discreet measure.
10. Show Me. Depending on the field selection in the data window, Tableau suggests the best-suited visualization. Different visualizations can be selected in the "Show Me” box.
11. Status bar. Displays various attributes of the visualization in the current worksheet. It displays information such as the number of Marks, the the number of rows and columns, and aggregated measures.
12. Sheet Name. Displays the name of the current worksheet. Give meaningful names to the sheets, if multiple sheets are created. There are three types of sheets - worksheet, dashboards, and story.
Exercise: Launch Tableau Desktop, connect to data source Sample – Superstore.xls under \Documents\My Tableau Repository\Datasources\. Use Orders datasheet as the source data. Refer to downloaded workbook – Tableau_QA_SolutionsWorkBook.twbx.
A Tableau professional’s responsibilities may differ based on specific organization but at high-level it consists of
-Und<brerstanding business requirements.
-Analyzing data sources and relationships.
-Extracting data from the required data sources. Making decisions in collaboration with Business users on connecting data live or as an extract.
-Applying required data transformations, creating calculations, Sets, Bins as driven by the requirements.
-Creating visualizations that help in answering business questions. These visualizations are created and displayed in Sheets, dashboards, and stories.
-Deploying the dashboards on the server
Every organization has certain measures that are used to evaluate performance. These measures or indicators are called Key Performance Indicators (KPI). KPI’s are different for different organizations, for example, for a Staffing company, one for the KPI may be # of Consultants working at the client site, for a hospital it may be the number for patients treated.
Tableau can be integrated into source control applications like Microsoft TFS (Team Foundation Server).
*/?>
*/?>
*/?>
*/?>