Data Interpretation - Bar Graph
Instructions:
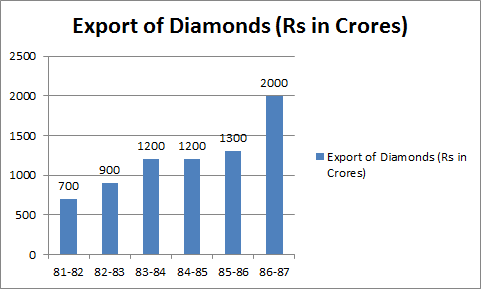
Study the following graph and answer the questions 46-47 given below


Instructions:
Study the following graph and answer the questions 46-47 given below

*/?>
*/?>
*/?>
*/?>