Data Interpretation - Bar Graph
Instructions:
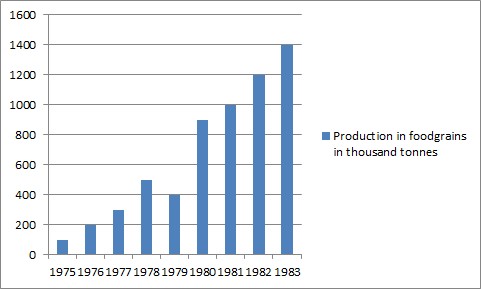
Directions: The bar chart showing the food production in India during 1975 to 1983 is shown in the following figure. Answer the questions below


Instructions:
Directions: The bar chart showing the food production in India during 1975 to 1983 is shown in the following figure. Answer the questions below
Instructions:
Directions: The bar chart showing the food production in India during 1975 to 1983 is shown in the following figure. Answer the questions below
Instructions:
Directions: The bar chart showing the food production in India during 1975 to 1983 is shown in the following figure. Answer the questions below
Instructions:
Directions: The bar chart showing the food production in India during 1975 to 1983 is shown in the following figure. Answer the questions below
