Data Interpretation - Tables

Instructions:  

Use the following table for these questions below

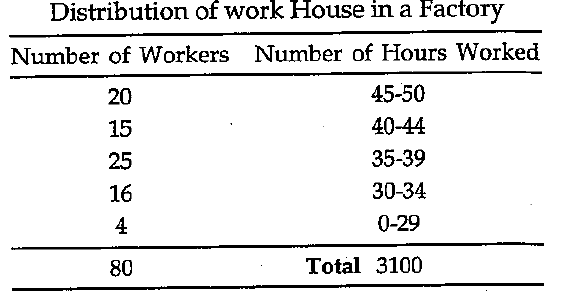
6. What percentage worked 40 or more hours?

  • Option : A
  • Explanation : The total number of workers i 80 and 35 of them worked 40 or more hours, therefore

    (35/80)*100 = 43.75%

Cancel reply

Your email address will not be published. Required fields are marked *


Cancel reply

Your email address will not be published. Required fields are marked *


Instructions:  

Use the following table for these questions below

7. The number of workers who worked from 40 to 44 hours is x times the number who worked up to 29 hours, where x is :

  • Option : B
  • Explanation : 15 people worked 40 to 44 hours and 4 worked up to 29 hours 4x = 15 => x = 15/4
Cancel reply

Your email address will not be published. Required fields are marked *


Cancel reply

Your email address will not be published. Required fields are marked *


Instructions:  

Use the following table for these questions below

8. Which of the following statements can be inferred from the table?

The average number of hours worked per worker is less than 40 At least 3 worked for more than 48 hours More than half of all the workers worked more than 40 hours

  • Option : A
  • Explanation : Statement can be inferred, since the average number of hours worked is 

    3100/80 = 38 3/4 i.e. less than 40

Cancel reply

Your email address will not be published. Required fields are marked *


Cancel reply

Your email address will not be published. Required fields are marked *


9. Click on next page for next question

Cancel reply

Your email address will not be published. Required fields are marked *


Cancel reply

Your email address will not be published. Required fields are marked *


10. Click on next page for next question

Cancel reply

Your email address will not be published. Required fields are marked *


Cancel reply

Your email address will not be published. Required fields are marked *