Tableau Interview Questions
When Tableau Desktop is launched it provides an option to connect to the data. Tableau can connect to a variety of data sources.
-When connecting to data, Tableau provides an option to connect to data Live or as an Extract.
-Data can be extracted to a .tde file. Extracts are faster than live connections.
-When data is extracted, the symbol of the data source changes in the data window. It shows up with two cylinders.
-Data Source can be saved as a TDS file or published to Tableau Server.
Exercise: Use Tableau sample data source Sample- Superstore.xls located under \My Tableau Repository\Data sources.
Connect to data live or as an extract.
When connected as an extract, it will provide an option to save the data source as a TDE file.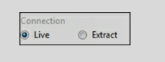
When a data source is created, Tableau automatically segregates data into Dimensions and Measure fields.
- Dimension fields contain the textual attribute of the data. It provides the context to the Measure. Dimensions are generally used to create labels and filters. Dimensions are discreet and appear blue in color in the data pane and the view.
- Measure fields contain the measurable attribute of the data - such as Revenue, Profit, or Population. Measures are continuous. They are axis in the charts and appear green color. Measures are analyzed by dimensions.
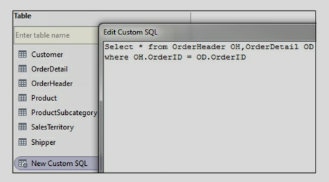
Tableau provides an option to write custom queries in New Custom SQL. A pre-built query can be copied/pasted in the query editor. The Developer can also use this space to write a custom query. New Custom SQL option is available when connected to relational data sources.
Data source preparation also called data transformation is an important step in dashboarding. Data Source preparation depends on Business and visualization requirements. -
- Review your source data to see if data is formatted correctly. If multiple tables or excel sheets are involved, look for the relationships between them. Create appropriate joins.
- For successful visualization, data should have dimensions and measures.
- If the source data contains a wrongly formatted Excel file, utilize Data Interpreter to format the file.
- Use Split to segregate concatenated columns and use Pivot to transform Rows to Columns.
- Data preparation may include renaming columns, creating hierarchies, Groups, and calculations.
Data should be prepared so that it improves user experience and helps in the development of visualizations.
-The Data source should be given a user-friendly name. Right-click on Data Source and select Rename.
-Dimension and Measure columns should be given user-friendly names. Right-click on a field and select Rename.
-the data types of the fields. If data types are incorrect then change the datatypes in Tableau.
-Related fields should be organized in Folders. Right-click on a field and select Group By/ Folder.
-Hierarchies help in drill-downs. Identify the columns to be included Hierarchy. Create Hierarchy by Shift or Ctrl select the columns to be included in Hierarchy, right-click, and select Hierarchy.
-Provide Aliases to give a meaningful description of the values. For example, if the Region is SZ, you can alias it to South Zone.
-Hide the columns, dimensions, and measures which are not used in the calculations or the view.
-Create Calculations to achieve the required functionality. Name calculations in a user-friendly manner.
-Apply appropriate filters to get meaning full data.
-Use extract when possible. Extracts are faster than live connections.
-Save the data source as a TDS file. This file can be shared and other developers can use this file for development.
*/?>
*/?>
*/?>
*/?>