Tableau Interview Questions
Dimension filters are similar to the WHERE clause in the SQL query.
Measure filter is similar to the HAVING clause.
Measure filter is similar to the HAVING clause.
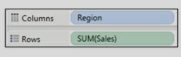
When a field is placed from the data window into the view canvas, Tableau creates a pill. Whether a pill is a dimension or measure or continuous or discreet affects the analysis and view.
-Dimensions are discreet and Measures are continuous.
-Discreet pills are blue in color and continuous are green in color.
-Dimension and Measure can be changed to discreet or continuous by right-clicking and selecting the desired type.
-When a continuous pill is dropped into the view it creates an axis.
-When a discreet pill is dropped into the view, it creates a label/header.
-Color is also decided to depend on whether - the pill is continuous or discreet.
-Filtering on a discreet field such as category will ask for the specific values.
-Filtering the continuous field such as profit will first ask if you want to filter at the row-level or
-Aggregate level and then bring up options for continuous ranges.
-In Maps, the default color depends on whether a field is continuous or discreet.
-A measure on Color will create a filled map. A dimension on the color will create a Symbol map. But whether the color is gradient or palette still depends on whether the pill/field is continuous or discreet.
Exercise: Use Tableau sample data source Sample- Superstore.xls located under \My Tableau Repository\Data sources.
Create a Map by using State and Region in one sheet and State and Sales in another sheet.
Refer to downloaded workbook – sheet/s - SymbolMap_Color and FilledMap_Color.
It is important to structure your workbook for ease of use and development.
-Fields can be organized in folders.
-Keep related fields in a folder.
-Hide all unused fields.
-Workbook many contain multiple sheets and dashboards. Color related sheets and dashboards.
-Hide unused worksheets.
-Fields can be organized in folders.
-Keep related fields in a folder.
-Hide all unused fields.
-Workbook many contain multiple sheets and dashboards. Color related sheets and dashboards.
-Hide unused worksheets.
Datasource can be replaced by following the below steps:
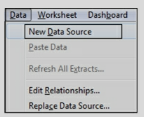
- Add a new data source to Tableau. Navigate to the main menu and select Data/New Data Source
- Make sure the new data source contains the same data structure in terms of calculations, hierarchies, parameters, etc.
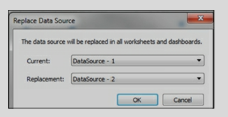
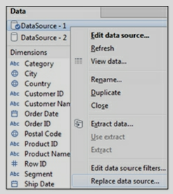
- Right-click on the old data source and select Replace data.
- Select the Current and Replacement data sources
- After replacing the Datasource, close the original data source.
- Add a new data source to Tableau. Navigate to the main menu and select Data/New Data Source
- Make sure the new data source contains the same data structure in terms of calculations, hierarchies, parameters, etc.
- Right-click on the old data source and select Replace data.
- Select the Current and Replacement data sources
- After replacing the Datasource, close the original data source.
*/?>
*/?>
*/?>
*/?>