bar1 Q2
Instructions:
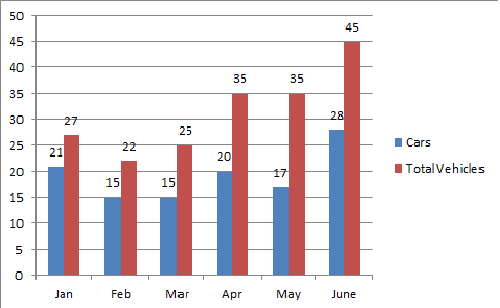
The following bar diagram shows the registration of cars and total vehicles during first six months of the year 1998 :
Study the above diagram and answer the questions (1 to 3) given below:
0. What was the percentage increase in registration of cars from May to June 1998?


- Option : C
- Explanation : Registration of cars in May = 17000
Registration of cars in June = 28000
Increase = ((11000/17000)*100)% = 64.7%

*/?>
*/?>
*/?>
*/?>