bar13 Q5

Instructions:  

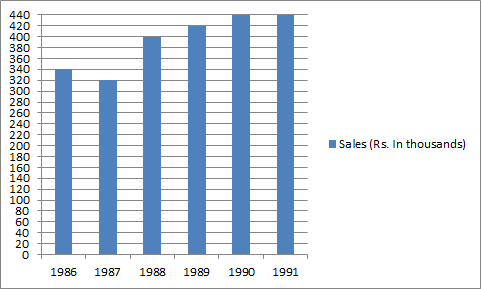
Study the following graph and answer the question 66-70   following it

By how much amount are the sales in 1989 more than those in 1987?

0. What are the approximate average sales (in thousands) for the years 1988 to 1991?

  • Option : D
  • Explanation : (400+420+440+440)/4 = 425
Cancel reply

Your email address will not be published. Required fields are marked *


Cancel reply

Your email address will not be published. Required fields are marked *