bar3 Q2

Instructions:  

Study the following graph carefully and answer the questions 11-14 which follow the graph
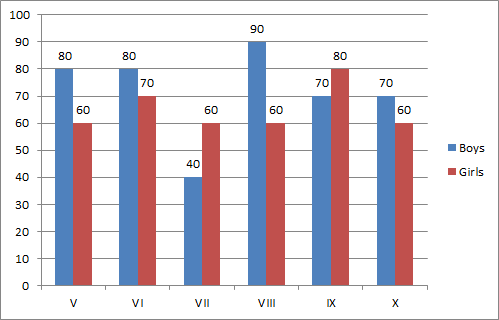
   In which standard is failure of girls lowest

0. The percentage difference between the results of girls and the boys is maximum in which standard?

Cancel reply

Your email address will not be published. Required fields are marked *


Cancel reply

Your email address will not be published. Required fields are marked *