line1 Q3

Instructions:
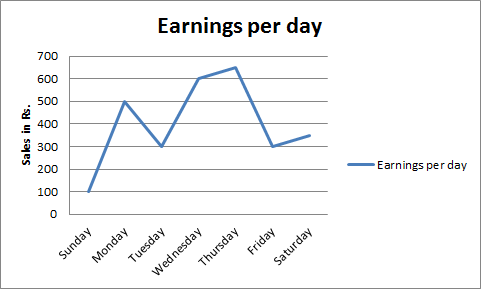
Directions. The graph given below represents the variations in earnings in rupees over a week. Study the graph and answer questions given below

  The difference in earnings was large between

0. The average earnings per day during the week was

Cancel reply

Your email address will not be published. Required fields are marked *


Cancel reply

Your email address will not be published. Required fields are marked *