pie9 Q2

Instructions:  

Directions. The circle graph given below shows the spending of a family on various items and its savings a year

If the total income of the family is Rs. 75000, the expenditure on children's education is

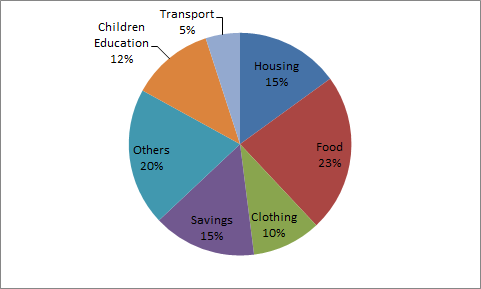
0. What percentage of the income was spent on transport and other items?

  • Option : A
  • Explanation : Clearly 25o of income was spent on transport and other items.
Cancel reply

Your email address will not be published. Required fields are marked *


Cancel reply

Your email address will not be published. Required fields are marked *