Data Interpretation - Pie Chart

Instructions:  

The following Pie diagrams shows the amounts that a family spends on food, clothing, rent, miscellaneous expenditure and savings: 

  If the annual income of the family is Rs. 60000, then the savings are:

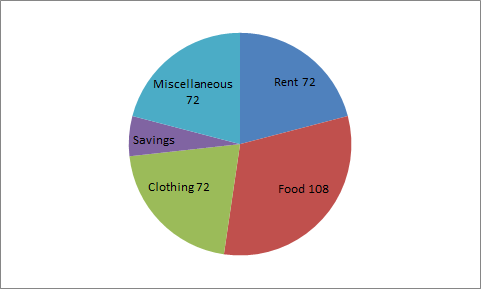
6. If the annual income of the family is Rs. 60000, then the savings are:

  • Option : B
  • Explanation : Central angle for savings = 360 - (108+72+72+72) = 36o

    Therefore, Savings = Rs. ( (36/360) * 60000) = Rs. 6000

Cancel reply

Your email address will not be published. Required fields are marked *


Cancel reply

Your email address will not be published. Required fields are marked *


7. Click on next page for next questionPIE

Cancel reply

Your email address will not be published. Required fields are marked *


Cancel reply

Your email address will not be published. Required fields are marked *


8. Click on next page for next question

Cancel reply

Your email address will not be published. Required fields are marked *


Cancel reply

Your email address will not be published. Required fields are marked *


9. Click on next page for next question

Cancel reply

Your email address will not be published. Required fields are marked *


Cancel reply

Your email address will not be published. Required fields are marked *


10. Click on next page for next question

Cancel reply

Your email address will not be published. Required fields are marked *


Cancel reply

Your email address will not be published. Required fields are marked *