Data Interpretation - Pie Chart
Instructions:
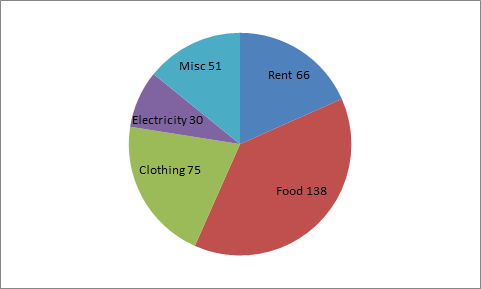
Study the pie-chart given below and answer the questions 11-13 Percentage of money spent on household items


Instructions:
Study the pie-chart given below and answer the questions 11-13 Percentage of money spent on household items
Instructions:
Study the pie-chart given below and answer the questions 11-13 Percentage of money spent on household items

*/?>
*/?>
*/?>
*/?>