Data Interpretation - Bar Graph
Instructions:
Study the following graph carefully and answer the questions 11-14 which follow the graph 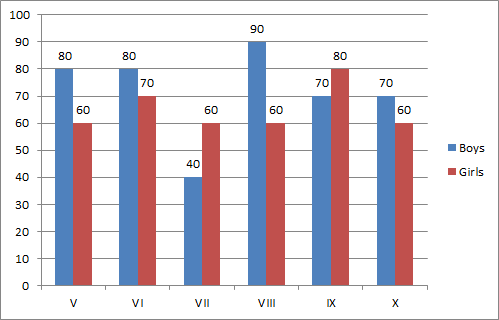


Instructions:
Study the following graph carefully and answer the questions 11-14 which follow the graph
Instructions:
Study the following graph carefully and answer the questions 11-14 which follow the graph
Instructions:
Study the following graph carefully and answer the questions 11-14 which follow the graph

*/?>
*/?>
*/?>
*/?>